It’s that time of year again. With 2017 soundly in the books, many companies are wrapping up the process of planning their annual report design, a document that board members, key customers and stakeholders will all receive. With a project as high-profile as this, the need to make a great impression is an obvious one. After all, an annual report is a reflection of the kind of year your company had, don’t you want to make it a good one?
Quality annual report design is one of the best ways you can ensure that your report will be as impressive as the year your team had, but unfortunately, many companies don’t make arrangements for the design process until after the report has been compiled. Involving an annual report designer earlier in the process can mean the difference between a report that serves as window dressing for the numbers and a report that drives reader engagement with a strong visual narrative.
A lot of brands consider creating an annual report to be an intimidating and far-reaching process. It doesn’t have to be this way. Regardless of how dry your data seems, great design can help you create an annual report that’s captivating to your audience and true to your brand.
In this article, we’ve included a few surefire tips that will help you plan out an annual report that’s dressed to impress.

Plan ahead to back up your narrative with quality quotes, stories and images.
When summing up their year, most organizations can point to a key accomplishment, theme or initiative that does a good job of exemplifying what made their year a great one. Make sure this isn’t lost on your audience by baking your accomplishments into a theme that’s carried through your document and reinforced in your copy, images and graphics.
Collecting data, imagery and quotes from executives in different departments can be rough, especially when your organization already has their sights set on the year ahead. To make the process easier, tackle it over time. As you’re writing content for your annual report, start filling a folder with photos, numbers and statements that back up your narrative. When it comes time to lay out your report, give your designer access to these resources. Quotes and graphs can help to break up text into more readable chunks and photos can help your audience connect with your story. Even if your organization doesn’t have enough quality imagery to fill your report, the tasteful use of some stock imagery can help highlight the trends that helped propel you to success.
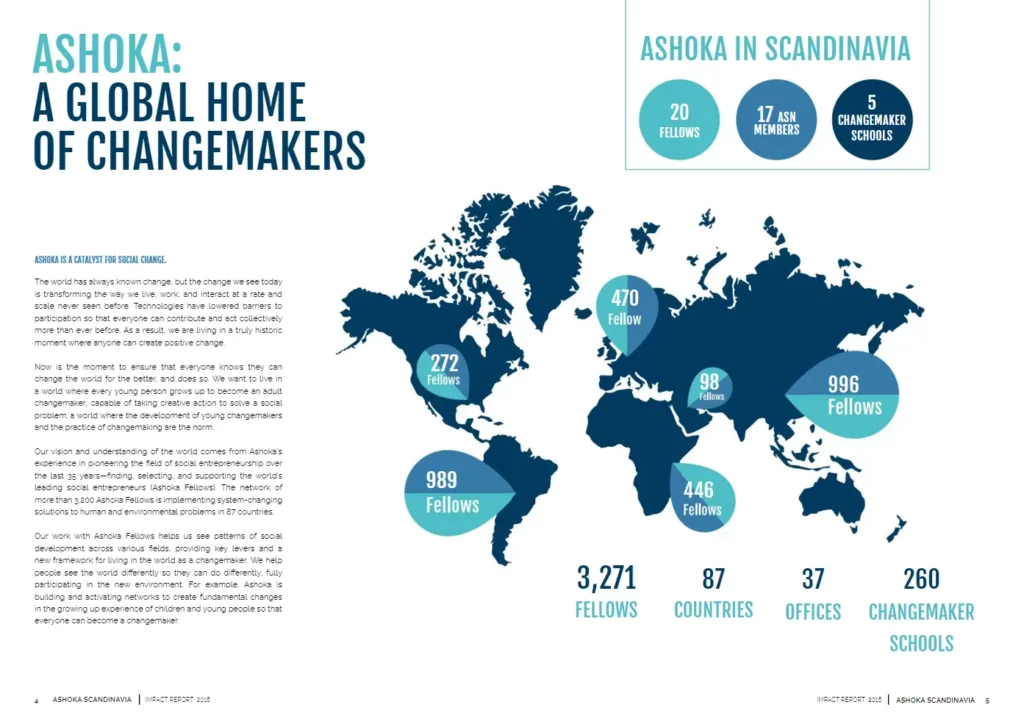
Make your data and financials come to life with infographics.
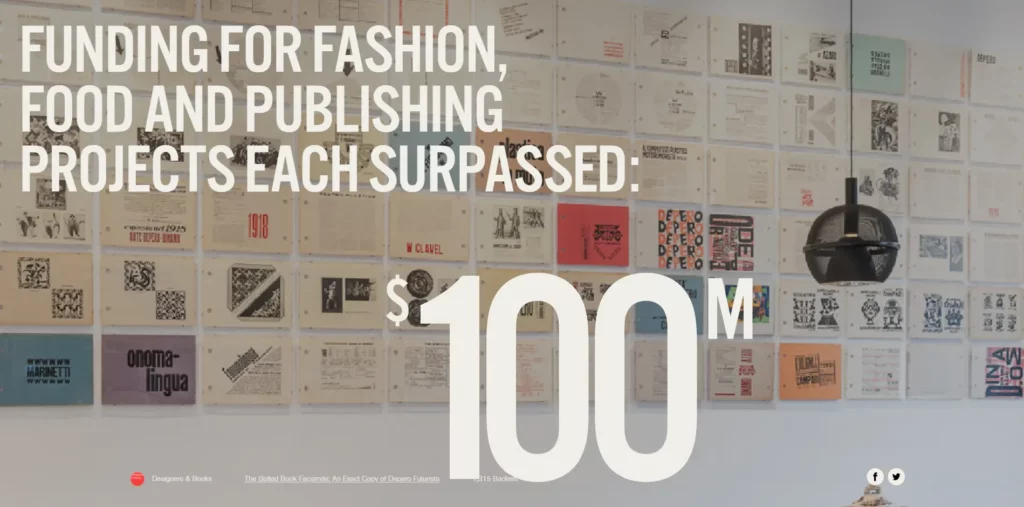
By their nature, annual reports are packed full of quantitative data that can be used a million different ways to help tell your story. But typically, financial reports aren’t always created in the most visually-consumable way. Help your audience come away from your report with key takeaways that demonstrate your accomplishments by using data visualizations to place the numbers that matter front and center in an aesthetically pleasing way.
Did your organization break into a new market, have a standout sales year or lay the groundwork for years of future success? Let your designer know. While you’re compiling information for your report, highlight the numbers that back up your narrative and brainstorm about how this might be visualized. A good annual report designer will find ways to turn even the most mundane of figures into attractive displays of data.
Embrace a variety of mediums.
While a print annual report is typically standard, don’t stop there. An annual report can be a great piece of content that drives website traffic, social shares and builds brand awareness when it’s distributed in a digital format. Take advantage of features you can include online or in your PDF document to make your annual report more user-friendly and engaging.
Include links to your website to elaborate on relevant services, case studies or pages. Bake in clickable CTAs that might guide a prospective new client or investor towards a desired action. Include share links that will allow your readers to post about your report on their LinkedIn page or retweet key stats about your year. Use document navigation to allow a reader to click through the table of contents to quickly find the information they need. When your annual report lives online and in print, the opportunities for additional engagement are endless.
No matter what your timeline or budget, you can always enhance your annual report with engaging design if you plan properly and know the tools at your disposal. Your annual report is a great opportunity to advance your brand and make a bold statement about your accomplishments. Don’t let it pass you by.
Work with an annual report designer to help bring your vision to life
If you need a hand designing your annual report and could use a partner to brainstorm how to make your document more memorable and engaging, the creative team at Form + Function would love to lend a hand. Drop us a line, we’d love to chat.